 It should come as no surprise that the relationship between the balance sheets of the world's major central banks and risk assets in general are relatively closely correlated (that is not to say dependent to avoid the causation/correlation 'out'). A great example is the tight coupling between the EURUSD exchange rate and the ECB and Fed balance sheets over the past few years - and just what the EURUSD (market) is implying about forward central bank action.
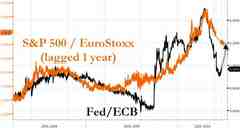
As Mark Faber has noted in the past though, the flood of liquidity from central bankers has the unintended consequence that they 'don't know' where that money will sloosh next. 2012 saw European stocks dramatically outperform US stocks, despite the 'unresolved issues', and the chart below of *lagged performance of US over European stocks relative to the Fed and ECB balance sheets, suggests that this 'catch-up' of Europe has considerably more legs going forward even as the Fed's balance sheet is set to expand by $1trillion this year*. A strange chart indeed...
Critically, while the global 'currency war' may be a zero sum game, the impact of the rise in global money 'supply' is not and that liquidity flows somewhere. It seems for most of the 2008-2011 period, it was the US' turn, but given the US relative richness on valuation, it would appear reality has caught up and now it is *Europe's turn to benefit nominally*.
Fed/ECB balance sheets are expected to be around 1.2x by the end of 2013 (perhaps less if the ECB is forced into OMT - though given Spain's comments it would appear that is less likely for now)... that *would imply the S&P 500 falls from 55% of the EuroStoxx 50 to around 50% of it - underperforming* - though of course both could nominally rise...
Chart: Bloomberg Reported by Zero Hedge 2 days ago.